Skip to Content
  What do you want to know ?     See more

Visualizing Biological Pathways

Foundations, Technologies, and Systems Biology Applications

Our store Contact us

 Introduction to Biological Pathway Visualization

Biological pathway visualization is a foundational discipline in modern bioinformatics, systems biology, molecular biology, and computational biology. Biological pathways represent structured networks of molecular interactions that explain how genes, proteins, metabolites, signaling molecules, and cellular regulators coordinate biological functions. These pathways provide an organized framework to understand cellular communication, metabolism, gene regulation, signal transduction, and disease mechanisms.

At their core, biological pathways model how molecular entities interact within living systems to maintain homeostasis, respond to environmental stimuli, and drive physiological or pathological responses. Rather than studying isolated molecules independently, pathway analysis allows researchers to investigate biological systems as interconnected functional networks.

Pathway models are built through experimental evidence, computational predictions, literature curation, and high-throughput omics data integration. They capture current scientific knowledge and continue evolving as new discoveries refine our understanding of molecular mechanisms.

Biological pathway visualization transforms these highly complex interaction networks into interpretable graphical models, enabling scientists to identify patterns, explore regulatory relationships, generate hypotheses, and simulate biological processes.
Learn more

biology,cell,exploration,molecular interactions

What Are Biological Pathways? 

Biological pathways are structured maps of molecular events occurring inside cells or organisms. They describe interactions among biomolecules involved in specific biological processes.

Core Components of Biological Pathways

A biological pathway generally consists of:
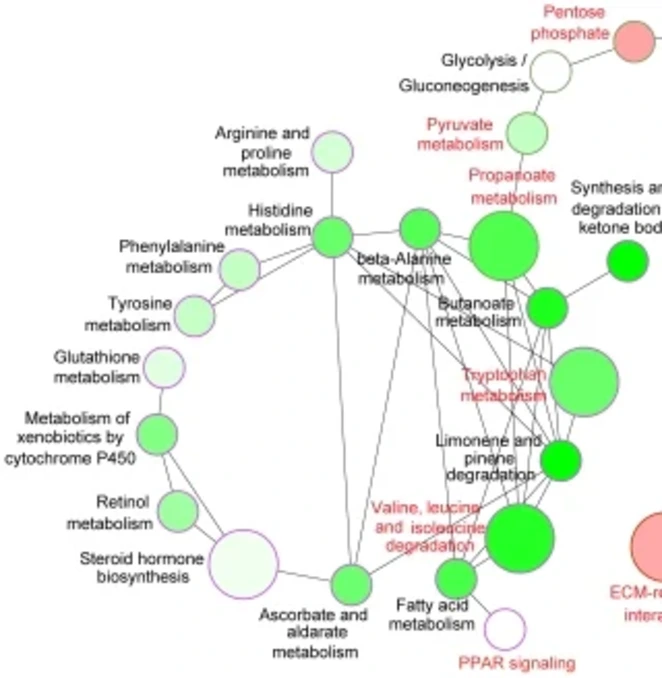
Nodes, Pathways significantly, interconnected subnetwork

Nodes

Nodes represent biological entities such as:

  • Genes
  • DNA and RNA molecules
  • Proteins and enzymes
  • Metabolites
  • Receptors
  • Hormones
  • Cytokines
  • Cellular compartments
  • Environmental signals

Depending on pathway type, a single node may also represent a larger biological module or even another pathway.
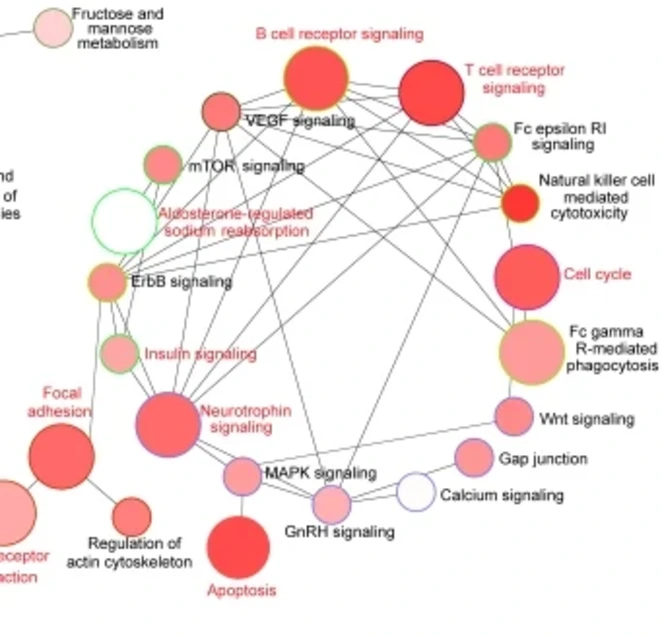
t individual pathways,interactions,kinetics,, Pathways,gene

Edges

Edges represent relationships or interactions between nodes, including:

  • Activation
  • Inhibition
  • Catalysis
  • Gene expression regulation
  • Phosphorylation
  • Protein binding
  • Transport events
  • Chemical conversion

These interactions often have directionality, kinetics, temporal properties, and regulatory dependencies.

Major Types of Biological Pathways


Biological pathways are commonly classified into several major categories. 

01. Metabolic Pathways

major metabolic pathways,Metabolic processe, cell,energy

Metabolic pathways describe biochemical reactions involved in synthesis or degradation of metabolites.

Examples include:

  • Glycolysis
  • Citric acid cycle
  • Oxidative phosphorylation
  • Fatty acid metabolism
  • Amino acid biosynthesis

Metabolic pathway maps help researchers study cellular energy production, metabolic fluxes, and disease-associated metabolic disruptions. 

02. Signal Transduction Pathways

Signal Transduction Pathways,Cellular & Molecular Biology,cellular growth ,receptor

Signal transduction pathways mediate how cells receive, transmit, and respond to external or internal signals.

Examples include:

  • MAPK signaling pathway
  • PI3K-Akt pathway
  • JAK-STAT signaling
  • Wnt signaling
  • NF-κB pathway

These pathways are central in cell communication, development, immunity, and cancer biology. 

03. Gene Regulatory Pathways

sequence of DNA,proteins,) regulatory network ,gene

Gene regulatory pathways describe molecular mechanisms controlling gene transcription and expression.

They involve:

  • Transcription factors
  • Promoters
  • Enhancers
  • RNA regulators
  • Epigenetic modifications

These networks are essential for understanding differentiation, development, and disease progression.

04. Protein Interaction Networks

disorder , medicine tools, proteins, DNA

Protein-protein interaction pathways represent physical or functional relationships between proteins.

These networks help identify:

  • Signaling hubs
  • Functional modules
  • Regulatory complexes
  • Drug targets

Protein interaction maps are widely used in systems medicine and network pharmacology.

Why Biological Pathway Visualization Matters

Modern biology generates enormous volumes of complex data through:

  • Genomics
  • Transcriptomics
  • Proteomics
  • Metabolomics
  • Single-cell sequencing
  • High-content screening
  • Functional genomics

These technologies can measure thousands of genes, proteins, or metabolites simultaneously.

Without pathway visualization, interpreting these large datasets in biological context becomes extremely difficult.

Pathway visualization enables researchers to:

  • Integrate diverse experimental results
  • Explore molecular relationships
  • Detect regulatory patterns
  • Identify pathway perturbations
  • Map omics data onto biological functions
  • Generate testable hypotheses
  • Support systems-level analysis

This makes pathway visualization an essential component of modern bioinformatics workflows.


Transition from Reductionist Biology to Systems Biology

Traditional biology often followed a reductionist approach, focusing on individual genes or isolated molecular interactions.

While powerful, this approach has limitations for understanding emergent biological behaviors.

Systems biology introduced a broader perspective, treating biological processes as interconnected dynamic systems.

This systems-level approach recognizes that:

The behavior of the whole system is often greater than the sum of its individual components.

Pathway visualization is central to this transition because it allows researchers to analyze:

  • Global network architecture
  • Pathway cross-talk
  • Feedback loops
  • Multi-pathway regulation
  • Dynamic network responses

This systems perspective is crucial for studying complex diseases, synthetic biology, and precision medicine.

Learn more

systems biology ,Reductionism versus systems biology, high-throughput data,genes, proteins
The network diagram represents the number of enzymes shared between pathways. Each pathway is represented by a node. Connections (edges) between these nodes represent the number of enzymes common to each pathway. Nodes are colored according to their superclass category; node size indicates the number of enzymes in that pathway; and thickness of edges indicate the number of enzymes common to each pathway

Biological Pathways as Network Graphs

Most pathway diagrams are represented mathematically as biological networks.

Graph-Based Representation

In graph theory terms:

  • Nodes represent biological components
  • Edges represent interactions

However, biological pathways often exceed simple graph models.

They may involve:

  • Directed graphs
  • Hypergraphs
  • Multimodal networks
  • Dynamic graphs
  • Hierarchical networks

Complex biological events may involve one interaction affecting another interaction itself, requiring advanced network representations.

This complexity creates major challenges for visualization design.

 Challenges in Biological Pathway Visualization

Biological pathway diagrams continue growing in complexity because of:

1. Scale

Pathways may contain hundreds or thousands of nodes.

Understanding large-scale molecular connectivity becomes increasingly difficult. 

2. Interconnectivity

Pathways rarely function independently.

Cross-talk between pathways can generate extensive interconnected biological networks.

Visualization systems must represent both local interactions and global network relationships. 

3.Dynamic Behavior

Biological processes are dynamic rather than static.

Pathways may involve:

  • Sequential reactions
  • Oscillations
  • Feedback regulation
  • State transitions
  • Time-dependent signaling

Capturing these dynamics visually remains a major challenge. 

Requirements for Effective Pathway Visualization Tools

Modern pathway analysis tools must support three major functional domains.

1. Pathway Assembly and Curation

Effective tools should support:


Researchers often build pathways using:

  • Literature sources
  • Reference databases
  • Experimental evidence
  • Community repositories

Visualization systems should facilitate pathway creation and updates.

Pathways should include:

  • Functional context
  • Biological significance
  • Supporting evidence
  • Experimental assumptions
  • Update history

Context improves interpretability.

Biological knowledge is rarely absolute.

Visualization platforms should distinguish:

  • Established interactions
  • Hypothesized relationships
  • Alternative models
  • Conflicting evidence

Representing uncertainty is essential in scientific modeling.


2. Information Overlay

Pathways are not only interaction maps but information-rich biological frameworks.


Visualization systems should represent:

  • Molecule types
  • Functional states
  • Interaction classes
  • Reaction rates
  • Regulatory properties

Visual encoding through shapes, symbols, and interaction styles improves interpretation.


Many pathways depend on cellular localization.

Examples include:

  • Nucleus
  • Cytoplasm
  • Membrane
  • Organelles

Spatially-aware pathway visualization improves biological realism.


Biological events often depend on timing.

Visualization should represent:

  • Sequential reactions
  • Time delays
  • Cyclic events
  • Concurrent processes

Temporal modeling is critical for signaling networks.


 High-Throughput Data Integration

One of the most important requirements is integrating omics datasets directly into pathway maps.

Examples include:

  • Microarray expression data
  • RNA-seq results
  • Proteomics abundance profiles
  • Metabolomics measurements

Overlaying experimental data on pathways enables functional interpretation.


 Conclusion

Biological pathway visualization has become a cornerstone of modern bioinformatics, systems biology, and molecular research. By transforming complex networks of genes, proteins, metabolites, and signaling molecules into interpretable graphical models, pathway visualization enables researchers to better understand the organization, regulation, and dynamics of biological systems. It supports the integration of experimental data, facilitates hypothesis generation, and provides a systems-level perspective that extends beyond traditional reductionist approaches.

As high-throughput technologies continue to generate increasingly large and multidimensional datasets, the need for advanced pathway visualization tools has become even more critical. Modern platforms not only allow the representation of molecular interactions, but also support data overlay, pathway interconnectivity analysis, multi-scale exploration, and predictive modeling. These capabilities are essential for uncovering biological mechanisms, understanding disease pathways, and accelerating discoveries in biotechnology and drug development.

Despite major advances, important challenges remain, including improving scalability, integrating spatial and temporal information, standardizing pathway representations, and developing more biologically meaningful visualization strategies. Future innovations combining interactive visualization, artificial intelligence, and multi-omics integration are expected to further strengthen pathway-based research and expand its applications in precision medicine and systems biology.

Ultimately, biological pathway visualization is more than a graphical tool—it is a powerful analytical framework that helps transform complex biological data into scientific insight. As research continues to move toward comprehensive systems-level understanding, pathway visualization will remain central to decoding the complexity of life.